|
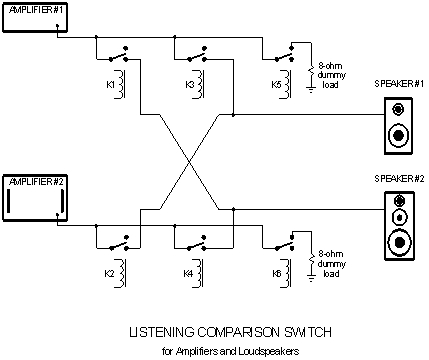
Home Entertainment Show 2007Listening & Measurement Workshops Peter Smith, Darren Kuzma and I are DIYers with quite a bit of experience at DIY loudspeaker gatherings. Last October we put together a set of audiophile workshops at the Rocky Mountain Audio Fest, and they were very well-received. John Atkinson of Stereophile subsequently invited us to repeat the workshops at the 2007 Home Entertainment Show (HE2007) in New York City, and supplied us an exhibitor room for them at the Grand Hyatt Hotel. Ray Kimber also kindly agreed to jointly sponsor our HE2007 workshops. The Workshops We named our group of workshops "Listening and Measurement". In a sense, we tried to plan something for everyone. The six workshops are listed below: Amplifier Listening Comparison We were thrilled with the response to the workshops. We had consistently good room traffic and all of the workshops were well-attended. The room was virtually never empty. In many cases, attendees stayed the whole hour for a workshop. Indeed, we were humbled by the fact that some people came back to the room several times. There is a very real thirst for knowledge and healthy curiosity out there among our audiophile brethren. One thing that may have worked in our favor is that we were simply different from most of the other rooms at the show. We were also gratified that a number of attendees remarked that our room sounded very good; this is certainly a compliment for DIY equipment at a show dominated by very expensive high-end audio gear. Below is a short summary of each of the six workshops. Amplifier Listening Comparison Few have ever been able to participate in a real-time, level-matched comparison of two power amplifiers driving the same speaker system in the identical acoustic environment. Two amplifiers were auditioned in real-time listening comparisons using a line-level matching scheme that does not degrade audio quality or introduce impedance-dependent colorations (e.g., as opposed to the use of L-pads that kill the damping factor). The custom-built listening comparison switch is housed in a 2U 19-inch enclosure. It includes two sets of amplifier inputs and two sets of speaker outputs. The switch employs carefully-selected relays for routing the power amplifier signals to the selected speakers. The unit is described in more detail elsewhere on this site under the Audio Instrumentation tab. The listening comparison involved a 35 Watt per channel "classic" vacuum tube amplifier and a very well-built solid state Denon amplifier rated at about 250 Watts per channel.
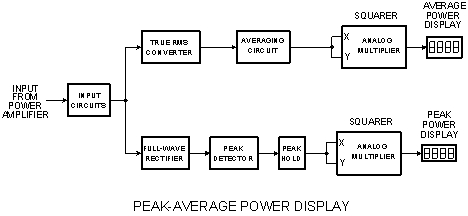
This was an interactive workshop, where one participant held a remote switch and could select either the vacuum tube or the solid state amplifier. Some people came away from this presentation amazed at how hard it is to hear variances in obviously different components, while others thought they could perceive subtle audible differences quickly. The vacuum tube amplifier was one of "classic" late Sixties type design. It was a DIY design originally built in 1966 that was completely updated about a year ago. Each channel employs a pair of KT-88's in a Class-AB pentode arrangement with fixed bias to deliver 35 Watts per channel (the KT88's were loafing at this power level). The amplifier employs a modest degree of negative feedback typical of amplifiers of the time, and achieves a damping factor of about 20. The amplifier is described in more detail elsewhere on this site under the Power Amplifier Design tab. Switching between amplifiers was done both at the line level input side and the speaker level output side of the amplifiers. The amplifier not selected received no input signal. Moreover, that amplifier was loaded with a dummy load, as it is well-known that some vacuum tube amplifiers may go unstable with no load. The comparison was level-matched to within 0.1 dB, as read at the speaker terminals with a 1 kHz test tone. Of course, the output impedance of the tube amplifier driving the varying impedance of the loudspeaker could have caused tenths of a dB variation at other frequencies across the band. This could have led to some coloration differences between the tube amplifier and the solid state amplifier that would distinguish their sound, but this is an inherent part of the whole tube vs solid state array of differences. One participant sitting in the sweet spot in a comfortable chair was given a remote switch to select which amplifier to audition. The switch was in a very small plastic project box and included green and blue LEDs that were illuminated alternately when one or the other of the amplifiers was selected. There was also a second indicator box in the equipment rack for all of the participants to see with a larger pair of green and blue LEDs providing the same information. A variety of music could be selected for the comparison. At the end of the session the attendees were polled in a very informal and unscientific way as to which amplifier they thought was the tube design. They could answer one amplifier or the other, or they could answer that they honestly could not tell which was which. There were no "night and day" results. Indeed, for many attendees the differences were difficult to hear. Moreover, those who perceived a difference were just as often wrong in selecting which amplifier they thought was the tube amplifier. This shocked all of us. Some participants got it right, but we have no way of knowing if they were just lucky or were better listeners than the others. Again, we must emphasize that this was a very unscientific test, so the only "take-away" is that the differences between tube and solid state for these particular two amplifiers were not easily discernable. Had we been using a "vintage" tube amplifier in the comparison (e.g., SET) rather than a "classic" design (e.g., Class AB push-pull), it is likely that differences would have been much more apparent. Loudspeaker Listening Comparison Loudspeaker auditioning is always a hot topic, but few have ever been able to participate in a real-time, level-matched comparison of two speaker systems driven by the same power amplifier. Level matching is critical to a proper listening test where different speakers are being compared. Unfortunately, simple level matching schemes employing L-pads introduce impedance-dependent colorations because they kill the amplifier damping factor. A line-level matching scheme was implemented for these listening tests that does not introduce those degradations. The custom-built listening comparison switch, which uses carefully-selected relays to route the signal to the selected speakers, is described elsewhere on this site under the Audio Instrumentation tab. It is the same piece of equipment that was used for the amplifier listening comparison. This listening comparison helped to demonstrate how hard it is to determine what sounds "right", and illustrated how one speaker can make the other sound "wrong". Being able to switch between two sets of speakers conveniently in a level-matched setup also makes it very easy to hear the different voicings of the speakers. Peter Smith, a long-time speaker designer, presented this workshop. Peter recently wrote an article describing his "NeoNoir" loudspeaker in AudioXpress Magazine. The participants in this workshop also enjoyed learning the basics of critical listening. Peter demonstrated the importance of listening with a variety of selected material, and how each audition cut can reveal something different about the loudspeaker. The Peak Power Demands of Well-recorded Music This attention-getting demonstration made many participants think twice about how much amplifier power is needed for the reproduction of well-recorded music that has good dynamic range. Participants in this workshop were able to see in real time the very high peak-to-average power ratio (crest factor) of music while they were listening to it. The high crest factor of well-recorded music can place very high peak-power demands on a power amplifier even at modest listening levels when loudspeakers of average efficiency are employed. This workshop demonstrated why high-power amplifiers sometimes sound better. Amplifiers may clip more often than we think. The presentation relied on a Peak/Average Power Display built specifically for the workshop. The display includes two large LED digital displays that read power in integer Watts into 8 ohms. The box displays true-rms-derived average power on a long-term basis on the left meter. This is meant to be a rough approximation of the perceived loudness; it is the average number of watts that it took to create that average level of loudness. The function of the "Peak" display on the right side of the box is to show the momentary average-calibrated power that occurs on musical peaks. It is the power that a conventionally-rated power amplifier would have to provide in order to reproduce that musical peak. Note that if one applies a continuous sinewave input to the Peak/Average Power Display, both meters will read identically. The custom-built device will accurately detect and display a musical peak that lasts as little as 10 microseconds and will hold it for one second before the reading begins to decay. A more detailed description of the Peak/Average Power Display (PAPD) and how it works is provided elsewhere on this site under the Audio Instrumentation tab. Most amplifiers have dynamic headroom of 0.5 to 3 dB. The PAPD will quickly give you an idea of this. When you just clip the amplifier you are using, you'll see the dynamic headroom power displayed. Compare this to the rated continuous sinewave power and you get a dB ratio that represents the dynamic headroom capability of the amplifier on real music.
A variety of music was used for this demonstration, but the musical cut with the highest crest factor we have found so far is Rickie Lee Jones' "Ghetto of my Mind" on her Flying Cowboys CD. Play this cut at even remotely realistic levels and monitor it with the Peak/Average Power Display and you will re-think how much power your amplifier needs to have. Of course, most music (unfortunately) is not this "bad" because of compression often added in the recoding process for the primary target market: car CD players and boom boxes. This demonstration was a real "Wow" for the attendees. The Rickie Lee Jones (RLJ) cut was played at realistic, but certainly not unpleasant, levels in the relatively small hotel exhibit room on speakers with an estimated sensitivity of about 89 dB. The average power typically read 1-2 Watts, while the power on peaks often topped 250 Watts (the power display monitored only one channel, so these numbers should be interpreted as Watts per channel). On this cut, most peaks occurred with an aggressive "thwack" to a snare drum positioned dead center. While it is true that the RLJ track has an unusually large dynamic range, this data still suggests that many listeners may be clipping their amplifiers more often than they think. This may especially be the case for those with tube amplifiers who are not using extraordinarily efficient speakers. The amount of clipping, and the way in which amplifiers handle clipping, may account for more of the perceived differences in amplifier sound than we realize. As an aside, it would be nice if all amplifiers had accurate and fast clipping indicators. It might be a real eye-opener. If your amplifier is clipping, have you left the realm of high fidelity? Peter published an article describing the peak power tests in the June 2007 issue of AudioXpress Magazine. Amplifier Measurement Clinic How are amplifier measurements done, what do they mean, and do they have any real value? This amplifier testing clinic showed attendees how audio power amplifiers are measured and which measurements are important. An example power amplifier was measured in a fashion similar to that done for Stereophile equipment reviews. This clinic was conducted by Bob Cordell, who is an amplifier designer experienced in tube, bipolar and MOSFET amplifier designs. Bob has also worked on developing new and more sensitive distortion tests for amplifiers. These include Multitone Intermodulation (MIM) and Phase Intermodulation (PIM) tests, as well as distortion magnifier techniques for measuring ultra-low levels of THD, crossover and TIM distortions. Live measurements on an actual amplifier were made and differences in measurements and design were discussed. In the course of the clinic, Bob shared his views on why amplifier measurements are not always a good predictor of sonic differences. The clinic began with an explanation of some amplifier review measurement charts kindly supplied by Stereophile's John Atkinson. These charts represented two different amplifiers reviewed by Stereophile. Charts used for illustration included frequency response into different loads, THD as a function of power into different loads, THD as a function of frequency into different loads, and twin-tone (19 kHz + 20 kHz) IM distortion spectra at high power. This part of the clinic gave attendees a chance to get familiar with measurements and what they mean before the actual live measurements were done. There was also ample opportunity here for Q & A on the topic. Live measurements were then performed on a real Amplifier Under Test (AUT). Equipment used included a THD analyzer, a spectrum analyzer (SA), a PC-based Digital Storage Oscilloscope (DSO), a 19+20 kHz twin-tone source, a high-power 8-ohm dummy load and several other pieces of related equipment. The Amplifier Under Test (AUT) was a DIY Chip Amp called the Super Gain Clone™. It is a 50-Watt per channel amplifier based on the National LM3886 operating in the inverting mode. It achieves a high input impedance and employs a low-distortion d.c. servo loop to avoid the use of capacitors anywhere in the signal path other than at the very input. The amplifier also includes a passive adaptive soft clipping circuit that can be enabled or disabled. The adaptive soft clip circuit prevents the LM3886 amplifier-proper from ever clipping while preserving the amplifier's dynamic headroom. Amplifiers incorporating negative feedback tend to clip sharply, and the soft clip circuit eliminates this behavior. The Super Gain Clone™ amplifier is described in more detail elsewhere on this site under the Power Amplifier Design tab. THD at 1 kHz was first measured at 50 watts to be about 0.002% - quite good. The AUT was then driven to clipping and the chopped tops of the amplifier's sinewave output were visible. In a second trace on the DSO, the ugly clipping distortion waveform from the distortion output of the THD analyzer was displayed. This signal represents what is left after the THD analyzer removes the 1 kHz test signal. Under these hard clipping conditions the THD analyzer read about 3 percent distortion. On the spectrum analyzer, the numerous harmonic distortion components ("pickets") were evident, along with lots of grunge above the noise floor of the analyzer between the harmonics and on the skirts of the harmonic pickets ("dirty skirts"). This was classic hard clipping. The soft clip circuit was then turned on. The amplifier's sinewave output was now clipped, but in a more civilized, rounded way. The distortion waveform changed, but its amplitude was still about the same. The THD analyzer still read about 3 percent. The spectrum analyzer still showed plenty of harmonic pickets, but they were mostly odd-order and they declined with increased frequency more so than with hard clipping. Very interestingly, the grunge between the harmonic pickets was now gone - the space between the harmonics was clean, residing at the noise floor of the spectrum analyzer. Probably mis-using an over-abused phrase, could this be analogous to the "silence between the notes"? Is the grunge between the harmonics that is there with hard clipping more dissonant than the larger harmonic pickets themselves? I don't know. It is often said that the audibility of distortion depends not only on its magnitude, but also on its nature. The soft clipping does not reduce the amount of distortion (it actually increases it at levels below clipping), but it gives it a more civilized nature. It is notable that tube amplifiers also tend to naturally clip in a way that is softer than that of a solid state amplifier. This workshop was well-attended and most participants stayed for the whole hour, engaging in lots of Q&A, particularly in regard to what influences the difference in sound between vacuum tube and solid state amplifiers. The THD analyzer, Distortion Magnifier and other useful audio test instrumentation are described in more detail elsewhere on this site under the Audio Instrumentation tab. Loudspeaker Measurement Clinic A live demonstration of speaker MLS testing was presented and many of the challenges in speaker design were discussed. This workshop was presented by Darren Kuzma. As the former speaker component systems manager at Parts Express, Inc., Darren was largely responsible for their very popular Reference components. Speaker measurement graphs kindly supplied by Stereophile's John Atkinson were used at the beginning of the workshop as examples. There was considerable discussion of the implications of the loudspeaker's measured step response in regard to driver time alignment and type of crossover, and whether or not the loudspeaker was transient accurate. Of course, the question as to whether the phase response of a loudspeaker is audible (i.e., whether it is transient-accurate) popped up a few times during the discussions. Darren then performed a live measurement of a loudspeaker using the CLIO PC-based acoustic measurement system. There was also discussion of alternative measurement setups that cost less. Much of this PC-based technology is available to the DIY community at a very affordable price. Throughout the workshop there was a relaxed open discussion of loudspeaker design issues by Darren. This workshop was invaluable for any attendee contemplating building his or her own speaker system. Active Loudspeakers - An Example Active loudspeakers tend to have an unfair advantage over their conventional cousins. In these speakers the amplifiers, crossovers and loudspeaker drivers are mated together to form a complete synergistic system. Such speaker systems have been very popular in the pro-sound arena for quite some time, but have yet to make a significant impact in the audiophile community. This may begin to change as more compact and efficient power amplifier technologies capable of high sonic quality emerge. A set of DIY active loudspeakers developed by Bob Cordell and called the Athena was described and auditioned in this presentation (not to be confused with products from the company called Athena Technologies). This loudspeaker integrates four conventional 125 Watt Class-AB MOSFET power amplifiers into each cabinet. The speaker demonstrates what can be accomplished in an audiophile active speaker system. The active configuration allows the loudspeaker to use a special form of vented box active equalization, called EQSS™, to achieve good bass extension and SPL in a small footprint. The 3-1/2-way mini-tower is only 39 inches high, 9 inches wide and 16 inches deep at its base. The loudspeaker consists of a 1-inch silk dome tweeter, a 3-inch cone midrange and four 5.25-inch woofers in a TMWWWW arrangement. The tweeter and midrange are each driven by a dedicated 125-Watt amplifier fed from a 3-way active crossover. They are crossed at 4 kHz with a first-order slope. The top two woofers are fed by a dedicated 125-Watt power amplifier, as are the bottom two woofers. The top two woofers are active from the lowest frequencies up to the midrange cross at 750 Hz. This crossover is also accomplished with a first-order slope. The bottom two woofers become active below 200 Hz. They are crossed with the upper two woofers with a constant-voltage half-way cross. This means that as frequency decreases and the bottom two woofers become active, the energy is re-distributed from the top two woofers to all four woofers without any change in frequency response. This is done so as to take advantage of the closer proximity of the upper two woofers to the midrange for purposes of the 750 Hz crossover. At the same time it provides the full benefit of the cone area of four woofers at frequencies below 200 Hz, where it is most needed. The proximity of the two lower woofers to the floor also mitigates floor-bounce effects. The baffle is sloped back by 11 degrees to provide time alignment of the drivers. This, in combination with the first-order crossovers, results in a transient accurate loudspeaker. The speaker also includes adjustable electronic baffle step compensation. The main objective of the speaker system was to achieve big sound from a small box. A related objective was to achieve this in a narrow box for improved imaging. This necessitated the use of small 5.25-inch woofers. The Equalized Quasi-Sealed System (EQSS™) technology made this possible. The 5.25-inch woofers have a free-air resonance of 53 Hz and are each allocated 9 liters of box volume. The box is tuned to 37 Hz with a 3-inch rear port. The system achieves a -3 dB response down to 35 Hz with a rolloff that is approximately second-order (Q = 0.7) down to below 25 Hz. Most importantly, excellent low-frequency SPL is achieved with this approach. These active loudspeakers are described in greater detail in a Power Point presentation elsewhere on this site under the Loudspeakers tab. The Equalized Quasi-Sealed System (EQSS™) technology is also described in more detail in a White Paper elsewhere on this site under the Equalized Quasi-Sealed System tab. The end always comes too soon The 2007 Home Entertainment Show ended at 5:00 p.m. on Sunday. It was a splendid weekend. My only regret is that I did not get to see more of the show. As an "Exhibitor", I discovered how difficult it is for exhibitors to see all of the show. Once again, Peter and Darren and I thank Ray Kimber and Stereophile for their help and generosity in making our workshops possible. |