|
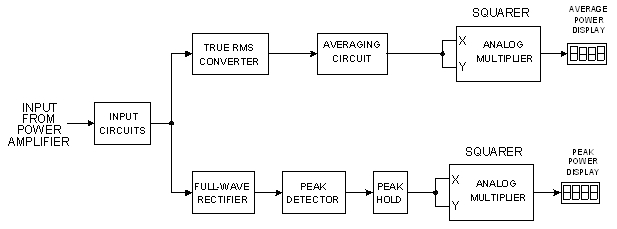
A Peak/Average Power Level MeterIntroduction Well-recorded music is characterized by short bursts of peak amplitudes that are much higher than the average level. This is generally referred to as the crest factor. The average power in music is what most affects how loud the program sounds to us, while the level of the much-higher peaks is an indication of the amount of dynamics in the music. These higher peaks can be so much higher than the average that power amplifiers are often in danger of clipping. This can happen even when one is not listening at an ear-splitting volume level. This can especially be the case when loudspeakers of low to average power sensitivity are used. The Peak-average meter described here is designed to display both the peak and average power being delivered to the loudspeaker simultaneously, with convenient digital readouts actually calibrated in watts. Here is a quick description of how the Peak-Average power display works. Keep in mind as we go that the semantics of peak and average and rms can get tricky. Peak and Average Power The function of the box is to display true-rms-derived average power on a long-term basis on the left meter. This is meant to be a rough approximation of the perceived loudness, and the average power in Watts that it took to make that average level of loudness. The function of the "Peak" side of the box is to display the momentary average-calibrated power that occurs on musical peaks. Let's take an example. If you had an amplifier rated at 50 watts continuous average power (some call it 50 watts rms) into 8 ohms, and that amplifier has no dynamic headroom, it will clip at a sine wave output of 20V rms, or a peak output voltage of 28V peak. On our box, if the amplifier briefly hits a peak output voltage of 28V on a snare drum thwack, the right meter will display 50 Watts. It is the power that a conventionally-rated power amplifier would have to have in order to reproduce that musical peak if the amplifier had no dynamic headroom (maximum power for brief intervals = maximum continuous average sinewave power). Performance The Peak-average meter will accurately detect and display a musical peak that lasts as little as about 20 microseconds. It will accurately capture the peak of a single-cycle 10 kHz sinusoid. It will detect when a new peak has occurred that is greater than the currently-displayed value and hold it for one second before any decay begins. This gives the LED digital panel meter (which updates three times per second) plenty of time to properly display the result. The circuitry to accomplish all of this is not trivial. How it Works A block diagram of the Peak-average meter is shown in Figure 1. There are two paths in the box: the "average" path to the left display and the "peak" path to the right display. The average path passes through a true-rms chip which produces a d.c. output that is representative of the long-term average (about 5 seconds) signal voltage. That d.c. voltage is then passed through a multiplier-based squaring circuit and scaling circuit to arrive at a d.c. level that represents average power. That voltage is presented to the digital panel meter, for a reading in integer Watts.
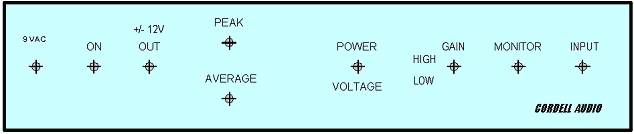
The "peak" path signal first passes through a full-wave rectifier and a fast peak detector. The resulting signal representing "stretched" peaks is then applied to a slower peak detector that has a gated decay. For one second after a new peak is detected, the decay is turned off, making that circuit a peak-hold circuit. The d.c. output represents the highest instantaneous peak voltage detected. That voltage is sent to a multiplier-based squaring circuit and scaled to make it represent average power on musical peaks for presentation to the digital panel meter. Note that if one applies a continuous sine wave input to the box, both meters will read identically. A signal is also available that indicates when a new peak arrives that is higher than the currently-displayed peak. This signal can be used to trigger a digital storage oscilloscope (DSO), if desired. Features and Use The front panel of the Peak-average meter is shown in Figure 2. It is very simple and contains only the two Jumbo LED readouts. The rear panel of the Peak-average meter is shown in Figure 3. It includes the input and output signal jacks and some mode switches. The unit is powered from a wall transformer, and the power input jack for that is also shown. Most amplifiers have dynamic headroom of 0.5 to 3 dB. The peak meter will quickly give you an idea of this. When you just clip the amplifier you are using, you'll see the dynamic headroom power displayed. Compare this to the rated continuous sine wave power and you get a dB ratio that represents the dynamic headroom capability of the amplifier on real music.
Features of the Peak-average meter are summarized as follows:
|